Getting a hearing test is a big step toward better hearing, but once the test is over, you may be handed a graph that looks like a puzzle of lines, numbers, and symbols. That graph is called an audiogram—and while it may seem technical, it’s a powerful tool that can help you understand your unique hearing needs.
This guide breaks down what each part of the audiogram means in clear, everyday language. Whether you're reviewing your first hearing test or trying to compare past results, learning how to interpret your audiogram helps you make informed choices about your hearing health and any treatments that may follow.
Key Takeaways
An audiogram is a graph showing the softest sounds you can hear at different frequencies.
It helps determine the type, degree, and pattern of your hearing loss.
Understanding your audiogram can empower you to take charge of your hearing care journey.
What an Audiogram Measures
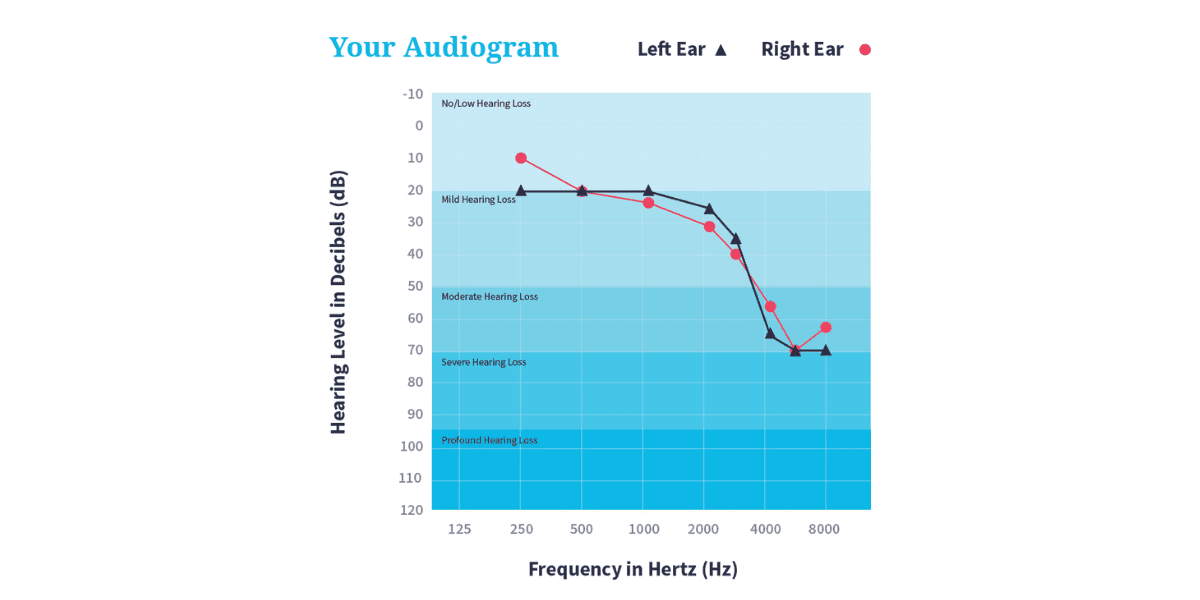
An audiogram displays your hearing thresholds across different pitches (frequencies) and volumes (decibels). It’s a snapshot of how well you hear sounds from low to high and soft to loud, with each ear tested independently. This information helps your provider identify the type and severity of your hearing loss.
Two key elements define your hearing test results:
Frequency (Hz): Measures pitch, or how high or low a sound is. Displayed along the horizontal axis, these range from low-pitched bass tones (250 Hz) to high-pitched consonants (8000 Hz).
Decibel (dB): Measures loudness, or the intensity of a sound. Displayed on the vertical axis, with softer sounds at the top and louder ones at the bottom.
Understanding how your hearing thresholds are plotted on these axes helps explain what types of sounds you may be missing.
Common Audiogram Symbols and What They Mean
Each audiogram uses a set of standard symbols to represent the test results for each ear. These are typically color-coded and plotted by ear:
Before we get into the symbols, it helps to know that your test may involve two types of sound delivery: air conduction and bone conduction. Air conduction tests sounds traveling through your ear canal; bone conduction sends vibrations directly through your skull to the inner ear.
Here are the most commonly used symbols:
O (red): Right ear, air conduction
X (blue): Left ear, air conduction
< or [ : Right ear, bone conduction
> or ] : Left ear, bone conduction
These symbols are plotted on the graph and then connected to show how your hearing changes across frequencies. If the lines overlap, your hearing is likely symmetrical. If not, you may have asymmetrical hearing loss, which means each ear hears differently and may require more specialized treatment.
Understanding the Axes of an Audiogram
When reading an audiogram, the layout is always the same. The horizontal and vertical axes give you the full picture of your hearing profile. Let’s explore what each means:
Frequency (Pitch) — Horizontal Axis
This axis shows sound frequencies from low to high, moving left to right. Lower frequencies include vowel sounds and deeper noises like thunder or male voices. Higher frequencies include softer consonant sounds like “s,” “th,” or “f,” which are crucial for understanding speech.
Decibels (Loudness) — Vertical Axis
This axis measures how loud a sound must be for you to hear it. Normal hearing typically falls within 0–25 dB. As the symbols on the graph fall lower (toward louder volumes), it indicates a higher degree of hearing loss.
Here's a quick guide to common hearing loss ranges:
Normal: -10 to 25 dB
Mild: 26 to 40 dB
Moderate: 41 to 55 dB
Moderately Severe: 56 to 70 dB
Severe: 71 to 90 dB
Profound: 91+ dB
The further down the graph your thresholds are, the more volume is required for you to hear those sounds.
Interpreting Hearing Loss Patterns
The shape of the lines on your audiogram can tell you a lot about the nature of your hearing loss. Different patterns reflect how your hearing is affected across the sound spectrum.
Symmetrical vs. Asymmetrical Hearing Loss
Symmetrical: Both ears have similar hearing thresholds across all frequencies.
Asymmetrical: One ear has significantly different thresholds, often suggesting medical evaluation by an ENT may be needed.
Sloping, Flat, or Reverse Sloping
Sloping Loss: High-frequency hearing loss is most common with aging.
Flat Loss: Equal loss across all frequencies, often due to genetic or congenital causes.
Reverse Sloping: More rare, with low-frequency sounds harder to hear than high-frequency ones.
Understanding these patterns can help guide the type of hearing aid or treatment that may be most effective.
What Is the Speech Banana?
One common visual overlay on an audiogram is the “speech banana,” a curved area on the graph that represents the typical frequencies and volumes of human speech. Most vowel sounds fall in the lower frequencies, while consonants (especially soft ones like “s” or “th”) sit higher on the spectrum.
If your thresholds fall outside this speech banana, it can help explain why you may struggle to understand conversations, even if you can technically “hear” some sounds.
Word Recognition Scores (WRS)
Your audiogram may also include a Word Recognition Score (WRS)—a percentage that indicates how well you understand speech. During this test, you're asked to repeat words or phrases at a comfortable loudness level. The WRS evaluates how clearly your brain interprets those words, not just whether you can hear them.
Why does this matter? Because even if hearing aids make sounds louder, they can't always improve word clarity if your brain struggles to process speech. This is why some hearing care providers use a WRS threshold (e.g., 50%) when determining if someone is a good candidate for hearing aids.
What Your Results Mean for Next Steps
Understanding your audiogram helps you become an active partner in your hearing care. Depending on your type and degree of hearing loss, your audiologist may suggest different treatment options, including hearing aids, medical evaluation, or follow-up monitoring.
Be sure to request a copy of your audiogram after every hearing test. It serves as a medical record and a baseline to track changes in your hearing over time.
Find the Hearing Aid That's Right For You
Related Hearing Health Resources
Types of Hearing Loss Explained
Where to Get a Hearing Test
Understanding Tinnitus
Frequently Asked Questions
How do I know if my hearing loss is mild or severe?Check where the symbols on your audiogram fall on the decibel scale. The further down they go, the more severe your hearing loss.
What does it mean if my audiogram looks different for each ear?That suggests asymmetrical hearing loss. You may need further testing from an ENT to rule out underlying medical issues.
Can hearing aids fix what I see on the audiogram?Hearing aids can improve your ability to hear sounds at different frequencies, but they can’t always restore clarity, especially if your Word Recognition Score is low.
Why does speech still sound muffled if my hearing aid is on?If your WRS is low, your brain may have trouble processing speech clearly, even if sounds are amplified. This is why early treatment matters.
Should I get my audiogram tested regularly?Yes. Experts recommend testing every 1–3 years if you have hearing loss or risk factors. Regular tests help track changes and adjust treatment if needed.
Sources:
Mayo Clinic – Hearing Loss Diagnosis & Tests
NIDCD – Hearing Testing